Charts
Charts display the same data as tables but in a graphical form.
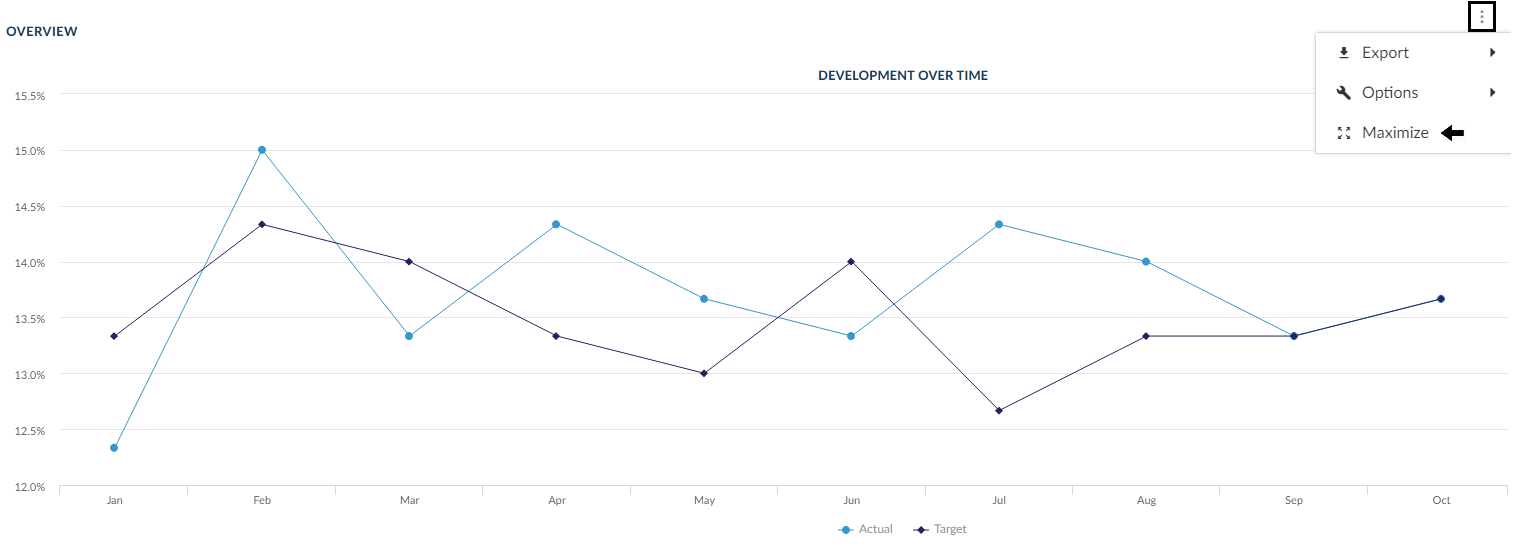
Maximize and collapse chart
You can maximize and minimize charts as follows:
- Select Maximize (
 ) or Collapse (
 ) from the chart's Function menu (
 )
) - Double-click the chart name once to maximize it.
Click it again to restore it to its initial size.
Export
You can export charts in the following formats: Microsoft Excel, PNG, JPG, and PDF.
Show as table
To display chart data as a table, select Show as table from the chart's Function menu (![]() ).
).
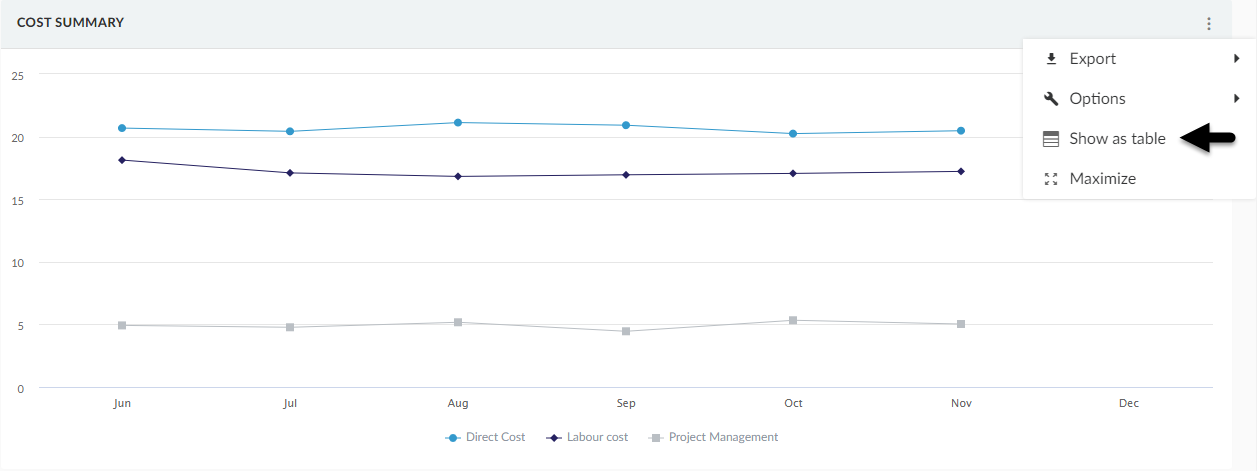
This option is currently unavailable for Gantt charts and risk charts.
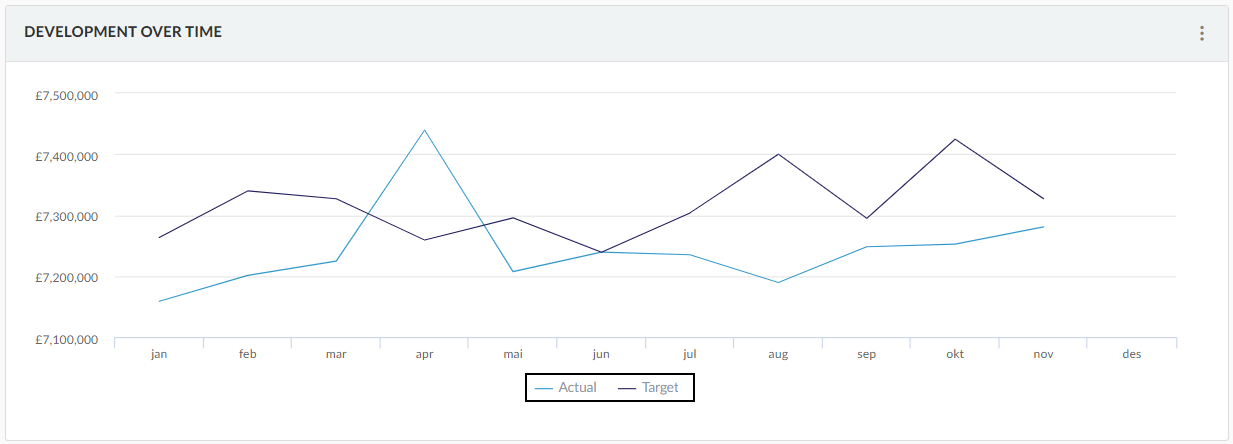
Filter chart data
To display filtered data for the chart, click a colored item from the chart legend.
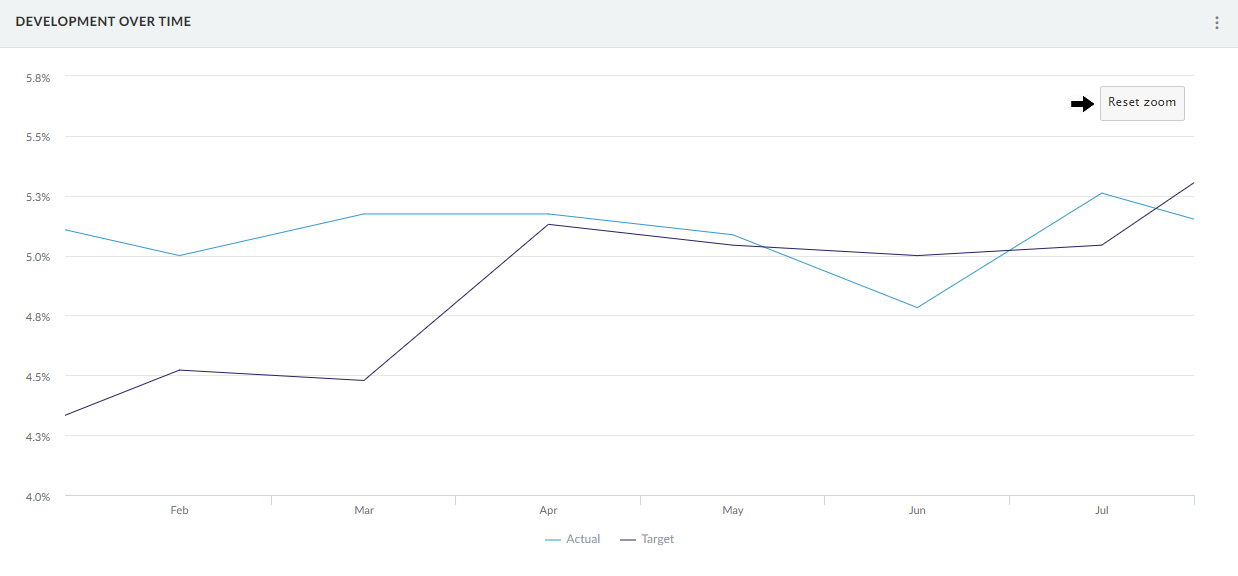
Zoom chart area
To focus on a specific region, make a rectangle selection of the area.
Because charts scale horizontally, the x-axis changes based on your selection.
Use the Reset zoom button to return the graph to its original size.
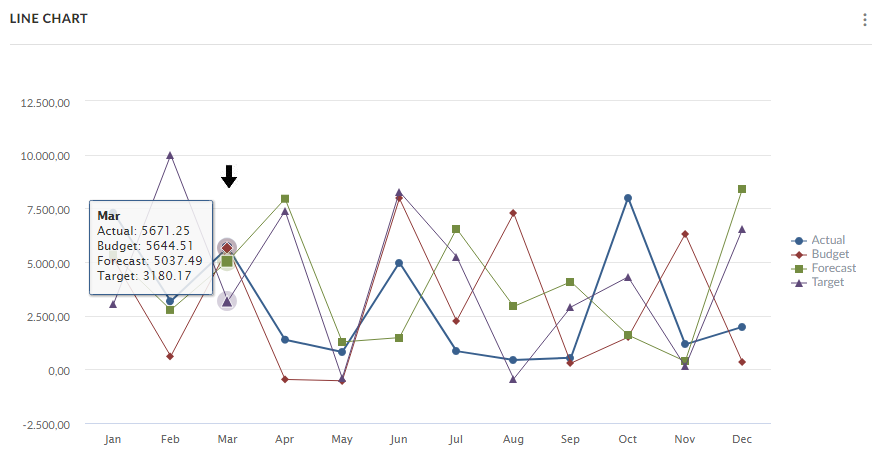
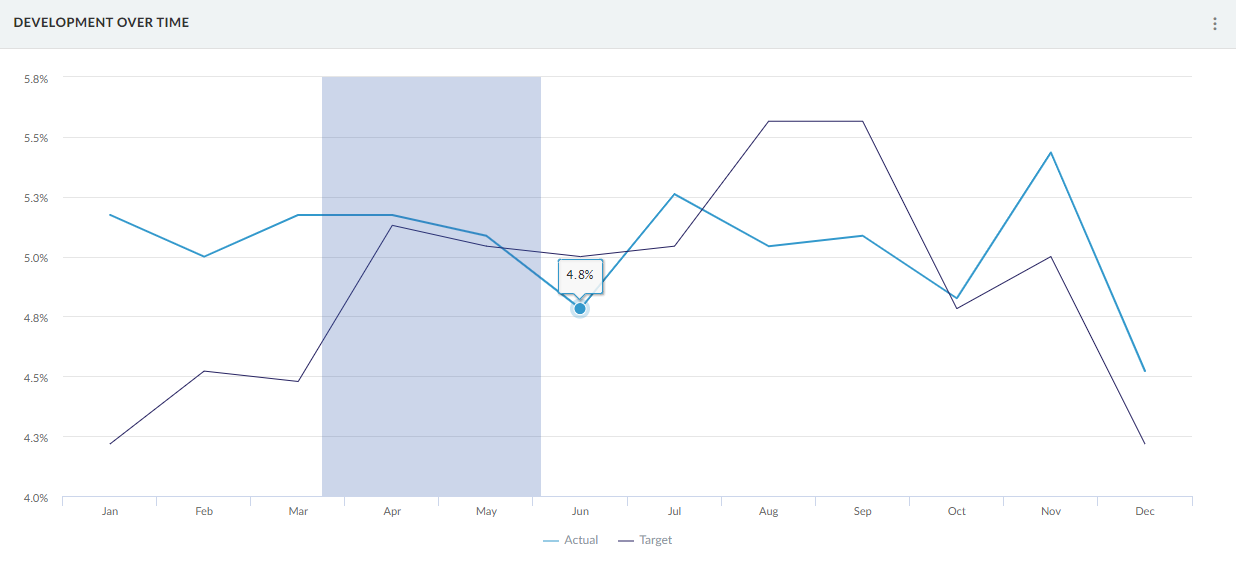
View data point information
To view values for a specific data point on the chart, hover over that data point and view its hover label.
If the point is located on the same vertical axis as other data points, the hover label includes information for each of these points.